Jasmycoin (JASMY): Cup & Handle Pattern Targets Major Fibonacci Levels – Analyst Insights

Date: Tue, Jan 28, 2025, 06:10 AM GMT
The cryptocurrency market is rebounding from yesterday’s sharp downturn, with Bitcoin (BTC) recovering from its 24-hour low of $97,795 to its current price of $103K.
Amid this turbulence, JasmyCoin (JASMY) also saw a significant drop to a 24-hour low of $0.02399, but it managed to bounce back to $0.02543, though it still remains in the red with a 26% monthly decline.
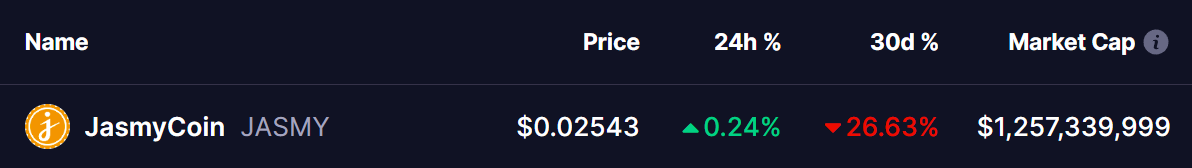 Source: Coinmarketcap
However, prominent crypto analyst Gert van Lagen provides a more optimistic outlook, focusing on long-term trends rather than short-term fluctuations.
Analyst Insights
According to Gert van Lagen, the weekly chart of JASMY is trdaing in Cup Handle pattern, a well-known bullish technical formation that often leads to strong upward price movements.
Key Technical Observations:
In February 2024, JASMY broke through a long-term descending trendline that had acted as strong resistance for over three years. This breakout marks a potential shift in market sentiment from bearish to bullish, suggesting renewed investor confidence.
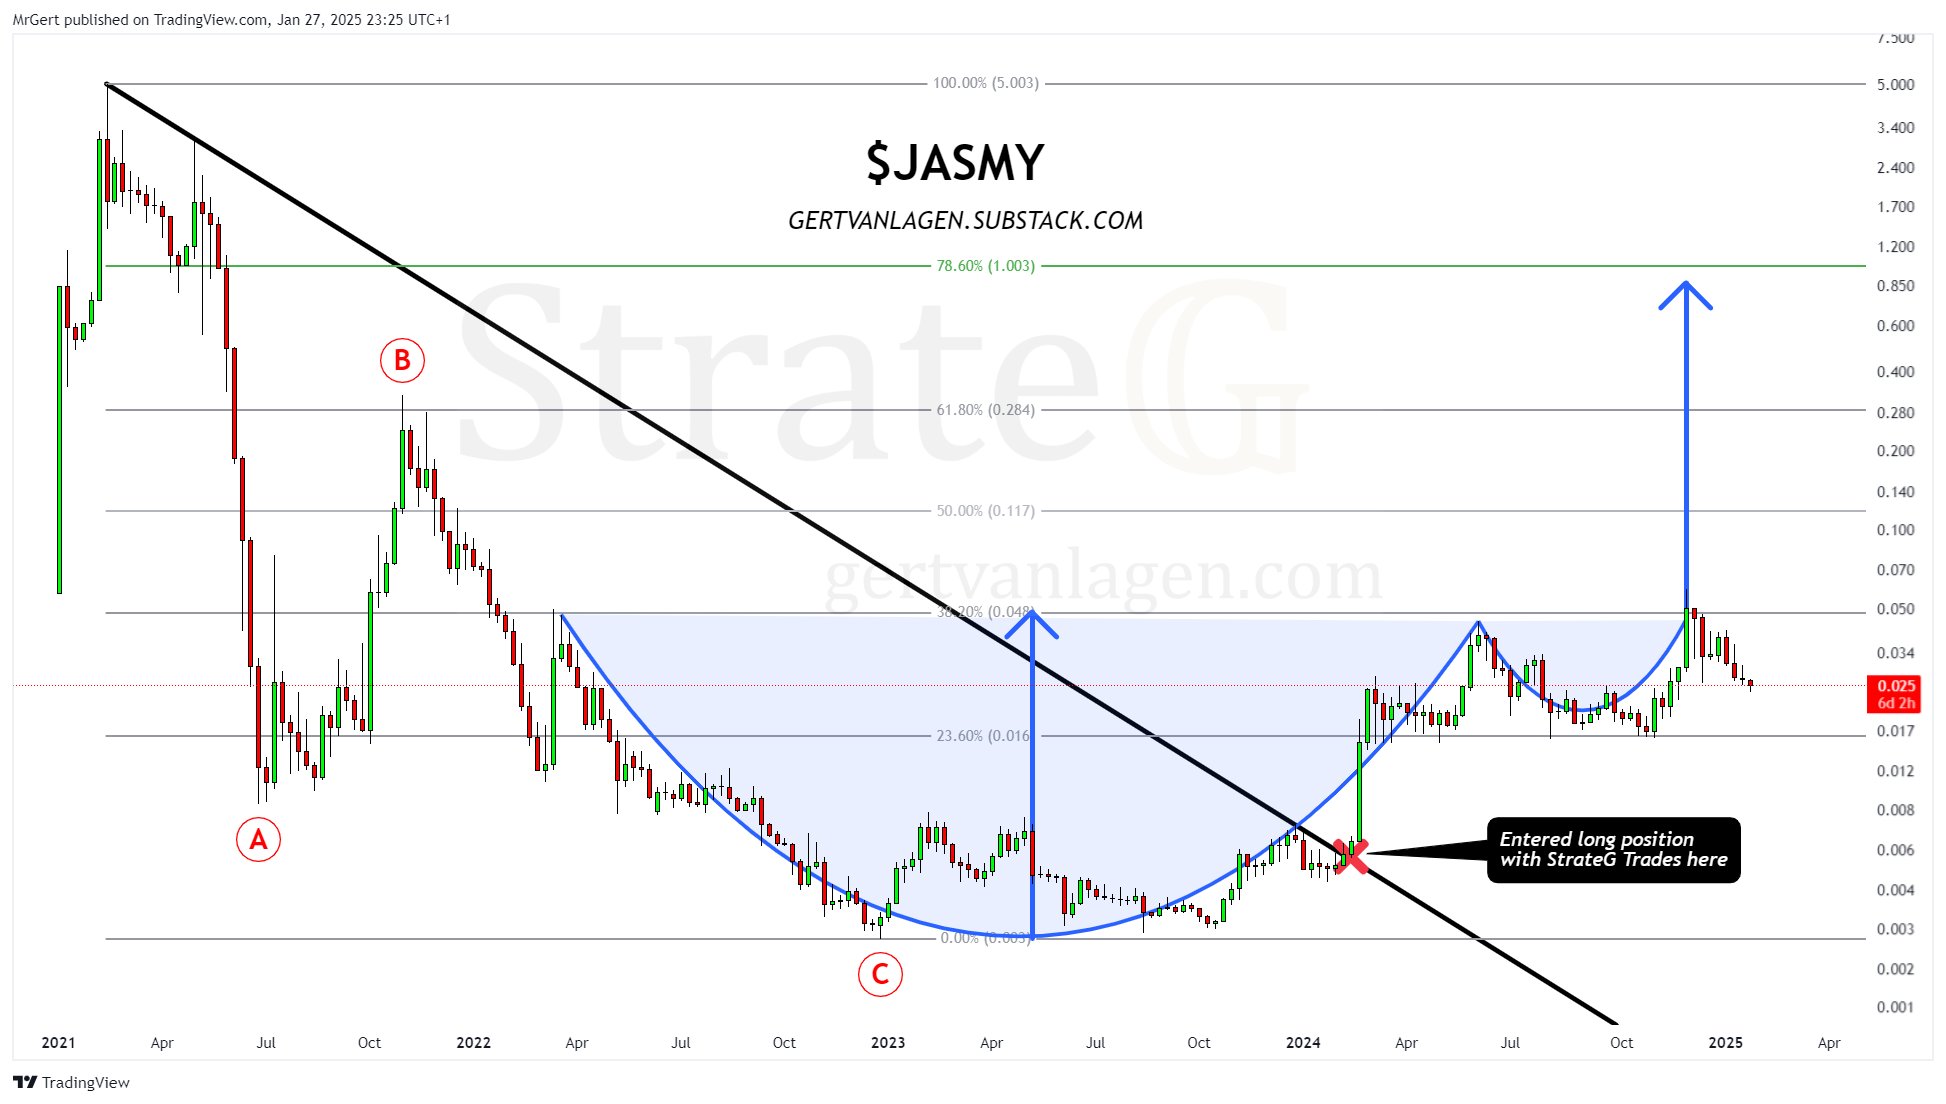 Jasmycoin (JASMY) W Chart/Source: @GertvanLagen (X)
A Cup Handle formation on the chart further reinforces this bullish outlook. The pattern consists of a large rounded bottom (Cup) followed by a smaller pullback (Handle)—a classic sign of accumulation before a breakout.
Fibonacci retracement levels highlight key price targets. The first major resistance aligns with the 23.6% retracement level at $0.016, which has already been tested. A breakout from the Handle at the 38.2% Fibonacci retracement level of $0.049 could propel JASMY toward the 61.8% retracement level at $0.30. The most significant long-term target remains the 78.6% Fibonacci retracement at $1.00, signaling the potential for a major rally.
Adding further bullish confirmation, a spike in trading volume following the breakout suggests strong buying interest and market momentum, reinforcing the case for continued upside potential.
Conclusion
Overall, the Cup Handle pattern on JASMY’s chart looks promising, signaling a potential long-term bullish breakout. Key Fibonacci levels suggest significant upside targets, with the possibility of a major rally in the long run.
However, despite this optimistic setup, the current bearish trend needs to be corrected by breaking through the Handle. A successful breakout above this resistance level would confirm the bullish continuation and strengthen the case for further price appreciation. Until then, traders should watch for key support and resistance levels, along with volume confirmation, before making decisive moves.
Disclaimer: This article is for informational purposes only and not financial advice. Always conduct your own research before investing in cryptocurrencies.
Disclaimer: The content of this article solely reflects the author's opinion and does not represent the platform in any capacity. This article is not intended to serve as a reference for making investment decisions.
You may also like
Nasdaq futures drop 2.7% amid trade war concerns

What's next for the crypto market after the Trump tariff-fueled price plunge?
Crypto prices plunged over the weekend amid risk-off sentiment following President Trump’s plan to implement heavy tariffs on imported goods from Canada, Mexico and China.While most analysts agree that tariffs are negative for crypto in the short term, some argue that, alongside other catalysts, they could ultimately benefit the asset class in the medium to long term.

Trump Tariffs Stir Crypto Sell-Off With Ether Tumbling Over 26%
Bitcoin prices plunged to a low of $92,460—falling below $100,000 for the first time since January.

Bitcoin Reserve Proposal Gains Ground with Bipartisan Support
